
Slika:Temperature Bar Chart Africa--1901-2020--2021-07-14.png
Velikost tega predogleda: 800 × 450 točk. Druge ločljivosti: 320 × 180 točk | 640 × 360 točk | 1.024 × 576 točk | 1.280 × 720 točk | 2.560 × 1.440 točk | 3.780 × 2.126 točk.
Izvorna datoteka (3.780 × 2.126 točk, velikost datoteke: 59 KB, MIME-vrsta: image/png)
Spodaj prikazane informacije so s tamkajšnje opisne strani.
Povzetek
| Opis |
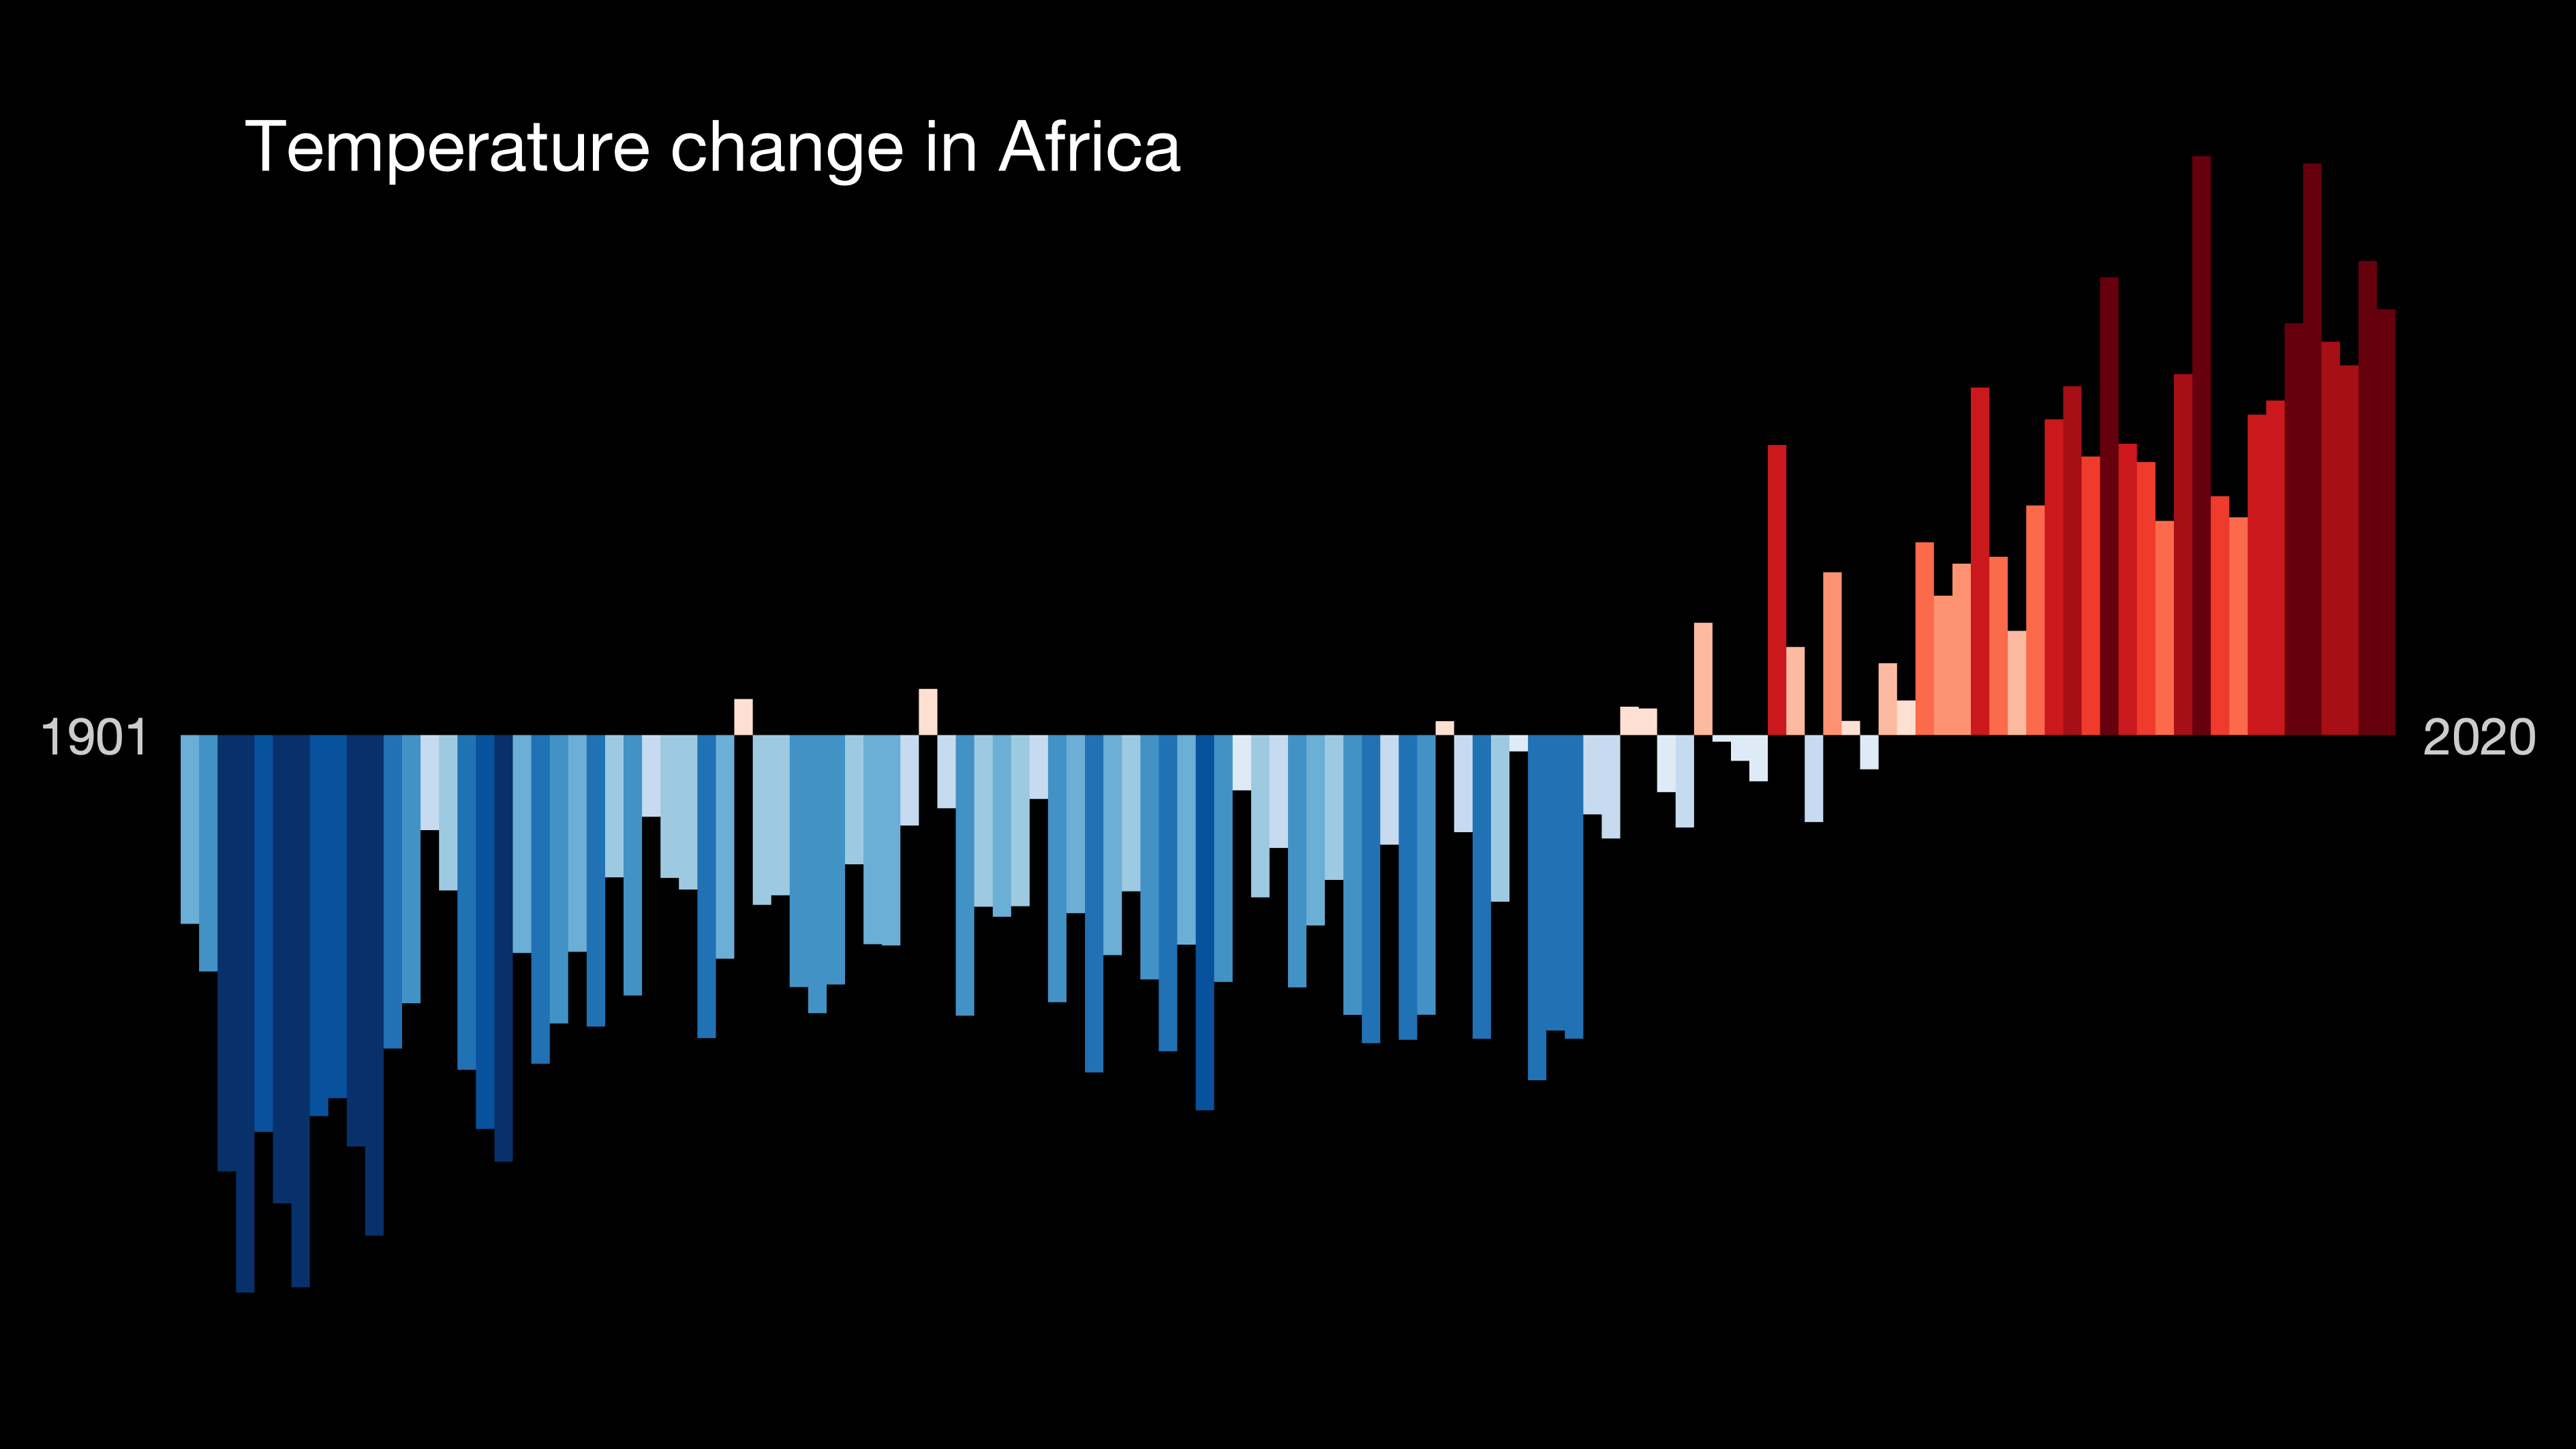
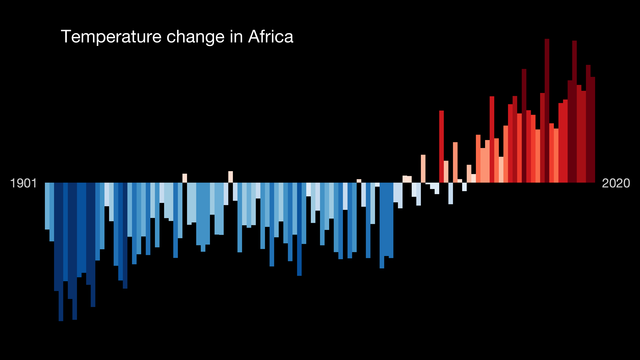
English: This bar chart is a visual representation of the change in temperature in the past 100+ years. Each stripe represents the temperature averaged over a year. The average temperature in 1971–2000 is set as the boundary between blue and red colors, and the color scale varies from ±2.6 standard deviations of the annual average temperatures between the years mentioned in the file name. Data source: Berkeley Earth. For more information visit https://showyourstripes.info/faq
Français : Graphique à barres, décrivant visuellement le changement de température durant un siècle : Chaque bande représente la température moyenne sur une année. La température moyenne de 1971 à 2000 est définie comme la limite entre les couleurs bleue et rouge, et l'échelle de couleurs varie de ± 2,6 écarts-types des températures moyennes annuelles entre les années (mentionnées dans le nom du fichier). Source : Berkeley Earth / https://showyourstripes.info/faq |
| Datum | |
| Vir | https://showyourstripes.info/ |
| Avtor | Ed Hawkins, University of Reading |
Licenca
Datoteka je objavljena pod licenco Creative Commons Priznanje avtorstva 4.0 Mednarodno.
- Dovoljeno vam je:
- deljenje – reproducirati, distribuirati in javno priobčevati delo
- predelava – predelati delo
- Pod naslednjimi pogoji:
- priznanje avtorstva – Navesti morate ustrezno avtorstvo, povezavo do licence in morebitne spremembe. To lahko storite na kakršen koli primeren način, vendar ne na način, ki bi nakazoval, da dajalec licence podpira vas ali vašo uporabo dela.
Zgodovina datoteke
Kliknite datum in čas za ogled datoteke, ki je bila takrat naložena.
| Datum in čas | Sličica | Velikost | Uporabnik | Komentar | |
|---|---|---|---|---|---|
| trenutno | 10:42, 14. julij 2021 | | 3.780 × 2.126 (59 KB) | DiagramLover | Uploaded a work by Ed Hawkins, University of Reading from https://showyourstripes.info/ with UploadWizard |
Uporaba datoteke
Datoteka je del naslednje 1 strani slovenske Wikipedije (strani drugih projektov niso navedene):
Globalna uporaba datoteke
To datoteko uporabljajo tudi naslednji vikiji:
- Uporaba na af.wikipedia.org
- Uporaba na en.wikipedia.org
- Uporaba na fr.wikipedia.org
- Uporaba na hy.wikipedia.org
- Uporaba na sr.wikipedia.org
- Uporaba na zh.wikipedia.org