
Slika:World energy consumption.svg

Velikost tega predogleda PNG datoteke SVG: 750 × 560 točk. Druge ločljivosti: 320 × 239 točk | 640 × 478 točk | 1.024 × 765 točk | 1.280 × 956 točk | 2.560 × 1.911 točk.
Izvorna datoteka (Datoteka SVG, nominalno 750 × 560 pikslov, velikost datoteke: 19 KB)
Spodaj prikazane informacije so s tamkajšnje opisne strani.
Povzetek
| Opis |
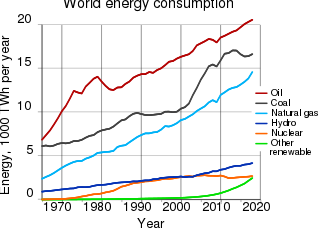
English: World energy consumption. Deutsch: Weltenergiebedarf. |
| Datum | |
| Vir | BP Statistical Review of World Energy 2017 |
| Avtor | Con-struct |
| Druge različice |
[]
|
| SVG razvoj | Ta vektorska slika je bila ustvarjena z Inkscape, or with something else. Ta datoteka uporablja vdelano besedilo, ki ga lahko preprosto prevedete z urejevalnikom besedil. |
| Note | English: This svg file contains the original graph data. Deutsch: Die svg-Datei enthält die dargestellten Daten als Original-Werte. |
| Template for indication of the source | <ref name="BP-Review-2014">BP: [http://www.bp.com/statisticalreview Statistical Review of World Energy], Workbook (xlsx), London, 2014</ref> |


Generated with Wikimedia SVG Chart
| Data format | The source data of the chart is in the SVG image file in a clearly readable format. You see the original numbers inside of the SVG file in the form of a list such as this:
... 1995 10.06 1996 11.75 1997 12.45 ... |
| Content of SVG | To view the data download the SVG file itself. To do so right-click this link, and then choose the option to save: File:World energy consumption.svg. Launch any text editor. Open the downloaded SVG file with the text editor (usually; file menu, open). To see the list of data, search for the phrase id="graph1". |
| Please, do not use a special SVG editor such as Inkscape; the readability of the database would be destroyed. You can edit the SVG file with any text editor, for example; en: List of text editors. You can view the edited SVG file in various web browsers. As of 2011, all major desktop browsers, and many minor ones, have some level of SVG support. See: en: Scalable Vector Graphics#Support for SVG in web browsers. When satisfied with your edits, upload the edited SVG file with the link labeled "Upload a new version of this file".
W3C-validity not checked. This chart was created with Wikimedia SVG Chart. Ta datoteka uporablja vdelano besedilo/števke. |
|
| Code to generate SVG | See: File talk:World energy consumption.svg. Documentation see: Wikimedia SVG Chart. |
Conversions

| - Power in Watt | |
| - Power in toe (tonne of oil equivalent) | |
| - Conversion factor of tonne of oil equivalent to watt, 11.63 megawatt hours / toe | |
| - Energy conversion efficiency, 38%, see BP statistical_review_of_world_energy_2013.pdf |


Example
| , statistical_review_of_world_energy_2013_workbook.xlsx, tab "Oil Production – tonnes", cell "AW89" | |
| , see Terawatt |


The conversion factor is exactly 4.4194 TWh/Mtoe, according to the ...workbook.xlsx, tab "Approximate conversion factors".
Licenca
Jaz, imetnik avtorskih pravic na tem delu, ga s tem objavljam pod naslednjimi licencami:

|
Ta dokument je dovoljeno kopirati, razširjati in/ali spreminjati pod pogoji Licence GNU za prosto dokumentacijo, različica 1.2 ali katera koli poznejša, ki jo je objavila ustanova Free Software Foundation; brez nespremenljivih delov ter brez besedil na sprednji ali zadnji platnici. Kopija licence je vključena v razdelek Licenca GNU za prosto dokumentacijo. |
Datoteka je objavljena pod licencami Creative Commons Priznanje avtorstva-Deljenje pod enakimi pogoji 3.0 Nedoločena, 2.5 Generična, 2.0 Generična in 1.0 Generična.
- Dovoljeno vam je:
- deljenje – reproducirati, distribuirati in javno priobčevati delo
- predelava – predelati delo
- Pod naslednjimi pogoji:
- priznanje avtorstva – Navesti morate ustrezno avtorstvo, povezavo do licence in morebitne spremembe. To lahko storite na kakršen koli primeren način, vendar ne na način, ki bi nakazoval, da dajalec licence podpira vas ali vašo uporabo dela.
- deljenje pod enakimi pogoji – Če boste to vsebino predelali, preoblikovali ali uporabili kot izhodišče za drugo delo, morate svoj prispevek distribuirati pod enako ali združljivo licenco, kot jo ima izvirnik.
Izberete lahko licenco po svoji izbiri.
Zgodovina datoteke
Kliknite datum in čas za ogled datoteke, ki je bila takrat naložena.
| Datum in čas | Sličica | Velikost | Uporabnik | Komentar | |
|---|---|---|---|---|---|
| trenutno | 01:38, 14. januar 2022 | | 750 × 560 (19 KB) | TAKAHASHI Shuuji | File uploaded using svgtranslate tool (https://svgtranslate.toolforge.org/). Added translation for ja. |
| 23:54, 25. julij 2019 |  | 750 × 560 (18 KB) | Wiklol | update; source: http://web.archive.org/web/20190616172232/https://www.bp.com/content/dam/bp/business-sites/en/global/corporate/xlsx/energy-economics/statistical-review/bp-stats-review-2019-all-data.xlsx | |
| 00:43, 5. december 2017 |  | 750 × 560 (106 KB) | Delphi234 | update | |
| 11:59, 11. junij 2016 |  | 750 × 520 (104 KB) | Delphi234 | update | |
| 07:29, 13. september 2015 |  | 750 × 520 (132 KB) | Delphi234 | remove transparency | |
| 07:22, 13. september 2015 |  | 750 × 520 (132 KB) | Delphi234 | remove transparency | |
| 07:16, 13. september 2015 |  | 750 × 520 (131 KB) | Delphi234 | convert text to path | |
| 06:23, 13. september 2015 |  | 750 × 520 (16 KB) | Delphi234 | update | |
| 06:26, 20. junij 2014 |  | 750 × 520 (17 KB) | Delphi234 | fix typo | |
| 06:23, 20. junij 2014 |  | 750 × 520 (17 KB) | Delphi234 | fix typo |
Uporaba datoteke
Datoteka je del naslednje 1 strani slovenske Wikipedije (strani drugih projektov niso navedene):
Globalna uporaba datoteke
To datoteko uporabljajo tudi naslednji vikiji:
- Uporaba na ar.wikipedia.org
- Uporaba na cs.wikipedia.org
- Uporaba na en.wikipedia.org
- Uporaba na es.wikipedia.org
- Uporaba na fa.wikipedia.org
- Uporaba na fr.wikipedia.org
- Uporaba na ha.wikipedia.org
- Uporaba na hu.wikipedia.org
- Uporaba na io.wikipedia.org
- Uporaba na ml.wikipedia.org
- Uporaba na pt.wikipedia.org
- Uporaba na sv.wikipedia.org
- Uporaba na th.wikipedia.org
- Uporaba na uk.wikipedia.org
- Uporaba na vi.wikipedia.org
- Chất dẻo
- Ấm lên toàn cầu
- Sản xuất chế tạo
- Anthropocene
- Đánh giá tác động môi trường
- Phá hủy sinh cảnh
- Bản mẫu:Tác động của con người với môi trường
- Thành viên:GregKaye
- Trồng rừng
- Population Matters
- Nông nghiệp hữu cơ
- Mỏ đá
- Vấn đề môi trường
- Tác động môi trường của dược phẩm và các sản phẩm chăm sóc cá nhân
- Tái trồng rừng
- Chu trình photpho
- Suy thoái đất
- Tác động môi trường của giấy
- Tác động của con người đến môi trường
- Mất đa dạng sinh học
- Tác động của công nghiệp năng lượng lên môi trường
- Tác động của sơn đến môi trường
Oglejte si globalno uporabo te datoteke.