
Slika:Rotation illustration.png

Velikost tega predogleda: 567 × 599 točk. Druge ločljivosti: 227 × 240 točk | 454 × 480 točk | 936 × 989 točk.
Izvorna datoteka (936 × 989 točk, velikost datoteke: 19 KB, MIME-vrsta: image/png)
Spodaj prikazane informacije so s tamkajšnje opisne strani.
Iz en.wikipedia v Zbirko prenesel uporabnik Maksim.
Izvorna opisna stran je bila tukaj. Vsa nadaljnja uporabniška imena se nanašajo na en.wikipedia.
Povzetek
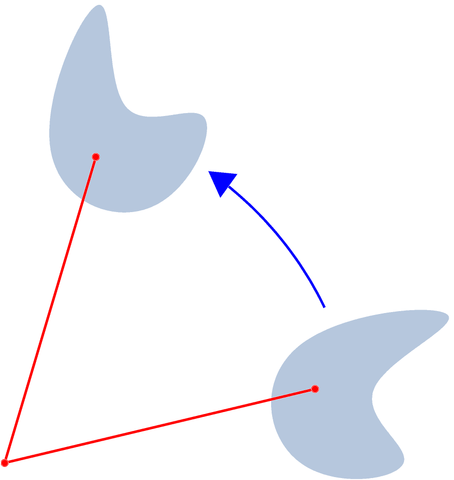
Made by myself with matlab.
Licenca
| Jaz, imetnik avtorskih pravic na tem delu, izročam to delo v javno domeno. To velja po vsem svetu. V nekaterih državah to pravno morda ni mogoče. Če je tako, Vsakomur dajem (v okviru zakonskih omejitev) brezpogojno pravico, da gradivo uporablja v kateri koli namen. |
Matlab source code
function main()

% prepare the screen
figure(1); clf; hold on; axis equal;  axis off;
linewidth=2;

x=[0, 0.7, 0.5 1, 0]+2; y=[0, 0, 0.5, 1 0.8];
do_plot(x, y, linewidth);

theta=pi/3; A=[cos(theta) -sin(theta); sin(theta) cos(theta)];
for i=1:length(x)
  v= A*[x(i); y(i)]; x(i)=v(1); y(i)=v(2);
end
do_plot(x, y, linewidth);

red=[1 0 0]; ball_radius=0.025;
x=2.1; y=0.5; plot([0 x], [0, y], 'color', red, 'linewidth', linewidth);
ball(x, y, ball_radius, red);

v= A*[x; y]; x=v(1); y=v(2); plot([0 x], [0, y], 'color', red, 'linewidth', linewidth);
ball(x, y, ball_radius, red);
ball(0, 0, ball_radius, red);

x=1.1*1.9681; y=1.1*0.9548; r=sqrt(x^2+y^2); thetas=atan2(y, x);
thetae=pi/6.2+thetas;
Theta=thetas:0.01:thetae; X=r*cos(Theta); Y=r*sin(Theta); plot(X, Y, 'linewidth', linewidth)
n=length(Theta);

arrow([X(n-1), Y(n-1)], [2*X(n)-X(n-1), 2*Y(n)-Y(n-1)], linewidth, 10, pi/6, 2, [0, 0, 1])

saveas(gcf, 'rotation_illustration.eps', 'psc2')

function do_plot(x, y, linewidth)
 n=length(x);
 P=5; Q=n+2*P+1; % P will denote the amount of overlap

% Make the 'periodic' sequence xp=[x(1) x(2) x(3) ... x(n) x(1) x(2) x(3) ... ]
% of length Q. Same for yp.
for i=1:Q
   j=rem(i, n)+1; % rem() is the remainder of division of i by n
   xp(i)=x(j);
   yp(i)=y(j);
end

% do the spline interpolation
t=1:length(xp);
N=100; % how fine to make the interpolation
tt=1:(1/N):length(xp);
xx=spline(t, xp, tt);
yy=spline(t, yp, tt);

% discard the redundant pieces
start=N*(P-1)+1;
stop=N*(n+P-1)+1;
xx=xx(start:stop);
yy=yy(start:stop);

lightblue=[176,196,222]/256;
H=fill(xx, yy, lightblue);

set(H, 'linewidth', 0.001, 'edgecolor', lightblue);

function arrow(start, stop, thickness, arrowsize, sharpness, arrow_type, color)


%  draw a line with an arrow at the end
%  start is the x,y point where the line starts
%  stop is the x,y point where the line stops
%  thickness is an optional parameter giving the thickness of the lines
%  arrowsize is an optional argument that will give the size of the arrow
%  It is assumed that the axis limits are already set
%  0 < sharpness < pi/4 determines how sharp to make the arrow
%  arrow_type draws the arrow in different styles. Values are 0, 1, 2, 3.

%       8/4/93    Jeffery Faneuff
%       Copyright (c) 1988-93 by the MathWorks, Inc.
%       Modified by Oleg Alexandrov 2/16/03


   if nargin <=6
      color=[0, 0, 0];
   end

   if (nargin <=5)
      arrow_type=0;   % the default arrow, it looks like this: ->
   end

   if (nargin <=4)
      sharpness=pi/4; % the arrow sharpness - default = pi/4
   end

   if nargin<=3
      xl = get(gca,'xlim');
      yl = get(gca,'ylim');
      xd = xl(2)-xl(1);
      yd = yl(2)-yl(1);
      arrowsize = (xd + yd) / 2;   % this sets the default arrow size
   end

   if (nargin<=2)
      thickness=0.5; % default thickness
   end


   xdif = stop(1) - start(1);
   ydif = stop(2) - start(2);

   if (xdif == 0)
      if (ydif >0)
	 theta=pi/2;
      else
	 theta=-pi/2;
      end
   else
      theta = atan(ydif/xdif);  % the angle has to point according to the slope
   end

   if(xdif>=0)
      arrowsize = -arrowsize;
   end

   if (arrow_type == 0) % draw the arrow like two sticks originating from its vertex
      xx = [start(1), stop(1),(stop(1)+0.02*arrowsize*cos(theta+sharpness)),NaN,stop(1),...
	    (stop(1)+0.02*arrowsize*cos(theta-sharpness))];
      yy = [start(2), stop(2), (stop(2)+0.02*arrowsize*sin(theta+sharpness)),NaN,stop(2),...
	    (stop(2)+0.02*arrowsize*sin(theta-sharpness))];
      plot(xx,yy, 'LineWidth', thickness, 'color', color)
   end

   if (arrow_type == 1)  % draw the arrow like an empty triangle
      xx = [stop(1),(stop(1)+0.02*arrowsize*cos(theta+sharpness)), ...
	    stop(1)+0.02*arrowsize*cos(theta-sharpness)];
      xx=[xx xx(1) xx(2)];

      yy = [stop(2),(stop(2)+0.02*arrowsize*sin(theta+sharpness)), ...
	    stop(2)+0.02*arrowsize*sin(theta-sharpness)];
      yy=[yy yy(1) yy(2)];

      plot(xx,yy, 'LineWidth', thickness, 'color', color)

%     plot the arrow stick
      plot([start(1) stop(1)+0.02*arrowsize*cos(theta)*cos(sharpness)], [start(2), stop(2)+ ...
		    0.02*arrowsize*sin(theta)*cos(sharpness)], 'LineWidth', thickness, 'color', color)

   end

   if (arrow_type==2) % draw the arrow like a full triangle
      xx = [stop(1),(stop(1)+0.02*arrowsize*cos(theta+sharpness)), ...
	    stop(1)+0.02*arrowsize*cos(theta-sharpness),stop(1)];

      yy = [stop(2),(stop(2)+0.02*arrowsize*sin(theta+sharpness)), ...
	    stop(2)+0.02*arrowsize*sin(theta-sharpness),stop(2)];

%     plot the arrow stick
      plot([start(1) stop(1)+0.01*arrowsize*cos(theta)], [start(2), stop(2)+ ...
		    0.01*arrowsize*sin(theta)], 'LineWidth', thickness, 'color', color)
      H=fill(xx, yy, color);% fill with black
      set(H, 'EdgeColor', 'none')

   end

   if (arrow_type==3) % draw the arrow like a filled 'curvilinear' triangle
      curvature=0.5; % change here to make the curved part more curved (or less curved)
      radius=0.02*arrowsize*max(curvature, tan(sharpness));
      x1=stop(1)+0.02*arrowsize*cos(theta+sharpness);
      y1=stop(2)+0.02*arrowsize*sin(theta+sharpness);
      x2=stop(1)+0.02*arrowsize*cos(theta)*cos(sharpness);
      y2=stop(2)+0.02*arrowsize*sin(theta)*cos(sharpness);
      d1=sqrt((x1-x2)^2+(y1-y2)^2);
      d2=sqrt(radius^2-d1^2);
      d3=sqrt((stop(1)-x2)^2+(stop(2)-y2)^2);
      center(1)=stop(1)+(d2+d3)*cos(theta);
      center(2)=stop(2)+(d2+d3)*sin(theta);

      alpha=atan(d1/d2);
      Alpha=-alpha:0.05:alpha;
      xx=center(1)-radius*cos(Alpha+theta);
      yy=center(2)-radius*sin(Alpha+theta);
      xx=[xx stop(1) xx(1)];
      yy=[yy stop(2) yy(1)];

%     plot the arrow stick
      plot([start(1) center(1)-radius*cos(theta)], [start(2), center(2)- ...
		    radius*sin(theta)], 'LineWidth', thickness, 'color', color);

      H=fill(xx, yy, color);% fill with black
      set(H, 'EdgeColor', 'none')

   end
| date/time | username | edit summary |
|---|---|---|
| 00:36, 22 November 2005 | en:User:Oleg Alexandrov | (+source code) |
| 14:06, 3 November 2005 | en:User:Oleg Alexandrov | (Made by myself with matlab.) |
Izvorni dnevniški zapis naložitve
Legend: (cur) = this is the current file, (del) = delete this old version, (rev) = revert to this old version.
Click on date to download the file or see the image uploaded on that date.
- (del) (cur) 23:24, 3 November 2005 . . en:User:Oleg_Alexandrov Oleg Alexandrov ( en:User_talk:Oleg_Alexandrov Talk) . . 936x989 (19116 bytes) (Made by myself with matlab. )
- (del) (rev) 14:06, 3 November 2005 . . en:User:Oleg_Alexandrov Oleg Alexandrov ( en:User_talk:Oleg_Alexandrov Talk) . . 562x593 (20124 bytes) (Made by myself with matlab. )

|
File:Rotation illus.svg je vektorska različica te datoteke. Kjer je primernejša, naj se uporablja namesto te rastrske slike.
File:Rotation illustration.png → File:Rotation illus.svg
Več informacij o vektorski grafiki je na voljo na strani Commons:Transition to SVG. Na voljo so tudi informacije o podprtosti SVG-slik v programju MediaWiki. |
 |
Zgodovina datoteke
Kliknite datum in čas za ogled datoteke, ki je bila takrat naložena.
| Datum in čas | Sličica | Velikost | Uporabnik | Komentar | |
|---|---|---|---|---|---|
| trenutno | 05:31, 6. junij 2007 | | 936 × 989 (19 KB) | Oleg Alexandrov | {{Information |Description=Made by myself with matlab. |Source=Originally from [http://en.wikipedia.org en.wikipedia]; description page is/was [http://en.wikipedia.org/w/index.php?title=Image%3ARotation_illustration.png here]. |Date=2005-11-03 (first ver |
| 12:06, 29. januar 2006 |  | 936 × 989 (19 KB) | Maksim | La bildo estas kopiita de wikipedia:en. La originala priskribo estas: == Summary == Made by myself with matlab. == Licensing == {{PD-self}} ==Source code (very messy)== <pre> <nowiki> function main() % prepare the screen figure(1); clf; hold on; axis |
Uporaba datoteke
Datoteka je del naslednje 1 strani slovenske Wikipedije (strani drugih projektov niso navedene):
Globalna uporaba datoteke
To datoteko uporabljajo tudi naslednji vikiji:
- Uporaba na cv.wikipedia.org
- Uporaba na en.wikipedia.org
- Uporaba na eo.wikipedia.org
- Uporaba na fr.wikipedia.org
- Uporaba na fr.wikibooks.org
- Uporaba na gl.wikipedia.org
- Uporaba na it.wikipedia.org
- Uporaba na mk.wikipedia.org
- Uporaba na ru.wikipedia.org
- Uporaba na sv.wiktionary.org
- Uporaba na ta.wikipedia.org
- Uporaba na tr.wikipedia.org
- Uporaba na zh.wikipedia.org