
Slika:Projected change in annual mean surface air temperature from the late 20th century to the middle 21st century, based on SRES emissions scenario A1B.png
Velikost tega predogleda: 800 × 429 točk. Druge ločljivosti: 320 × 172 točk | 640 × 343 točk | 1.024 × 549 točk | 1.280 × 686 točk | 2.811 × 1.507 točk.
Izvorna datoteka (2.811 × 1.507 točk, velikost datoteke: 672 KB, MIME-vrsta: image/png)
Spodaj prikazane informacije so s tamkajšnje opisne strani.
Povzetek
| Opis |
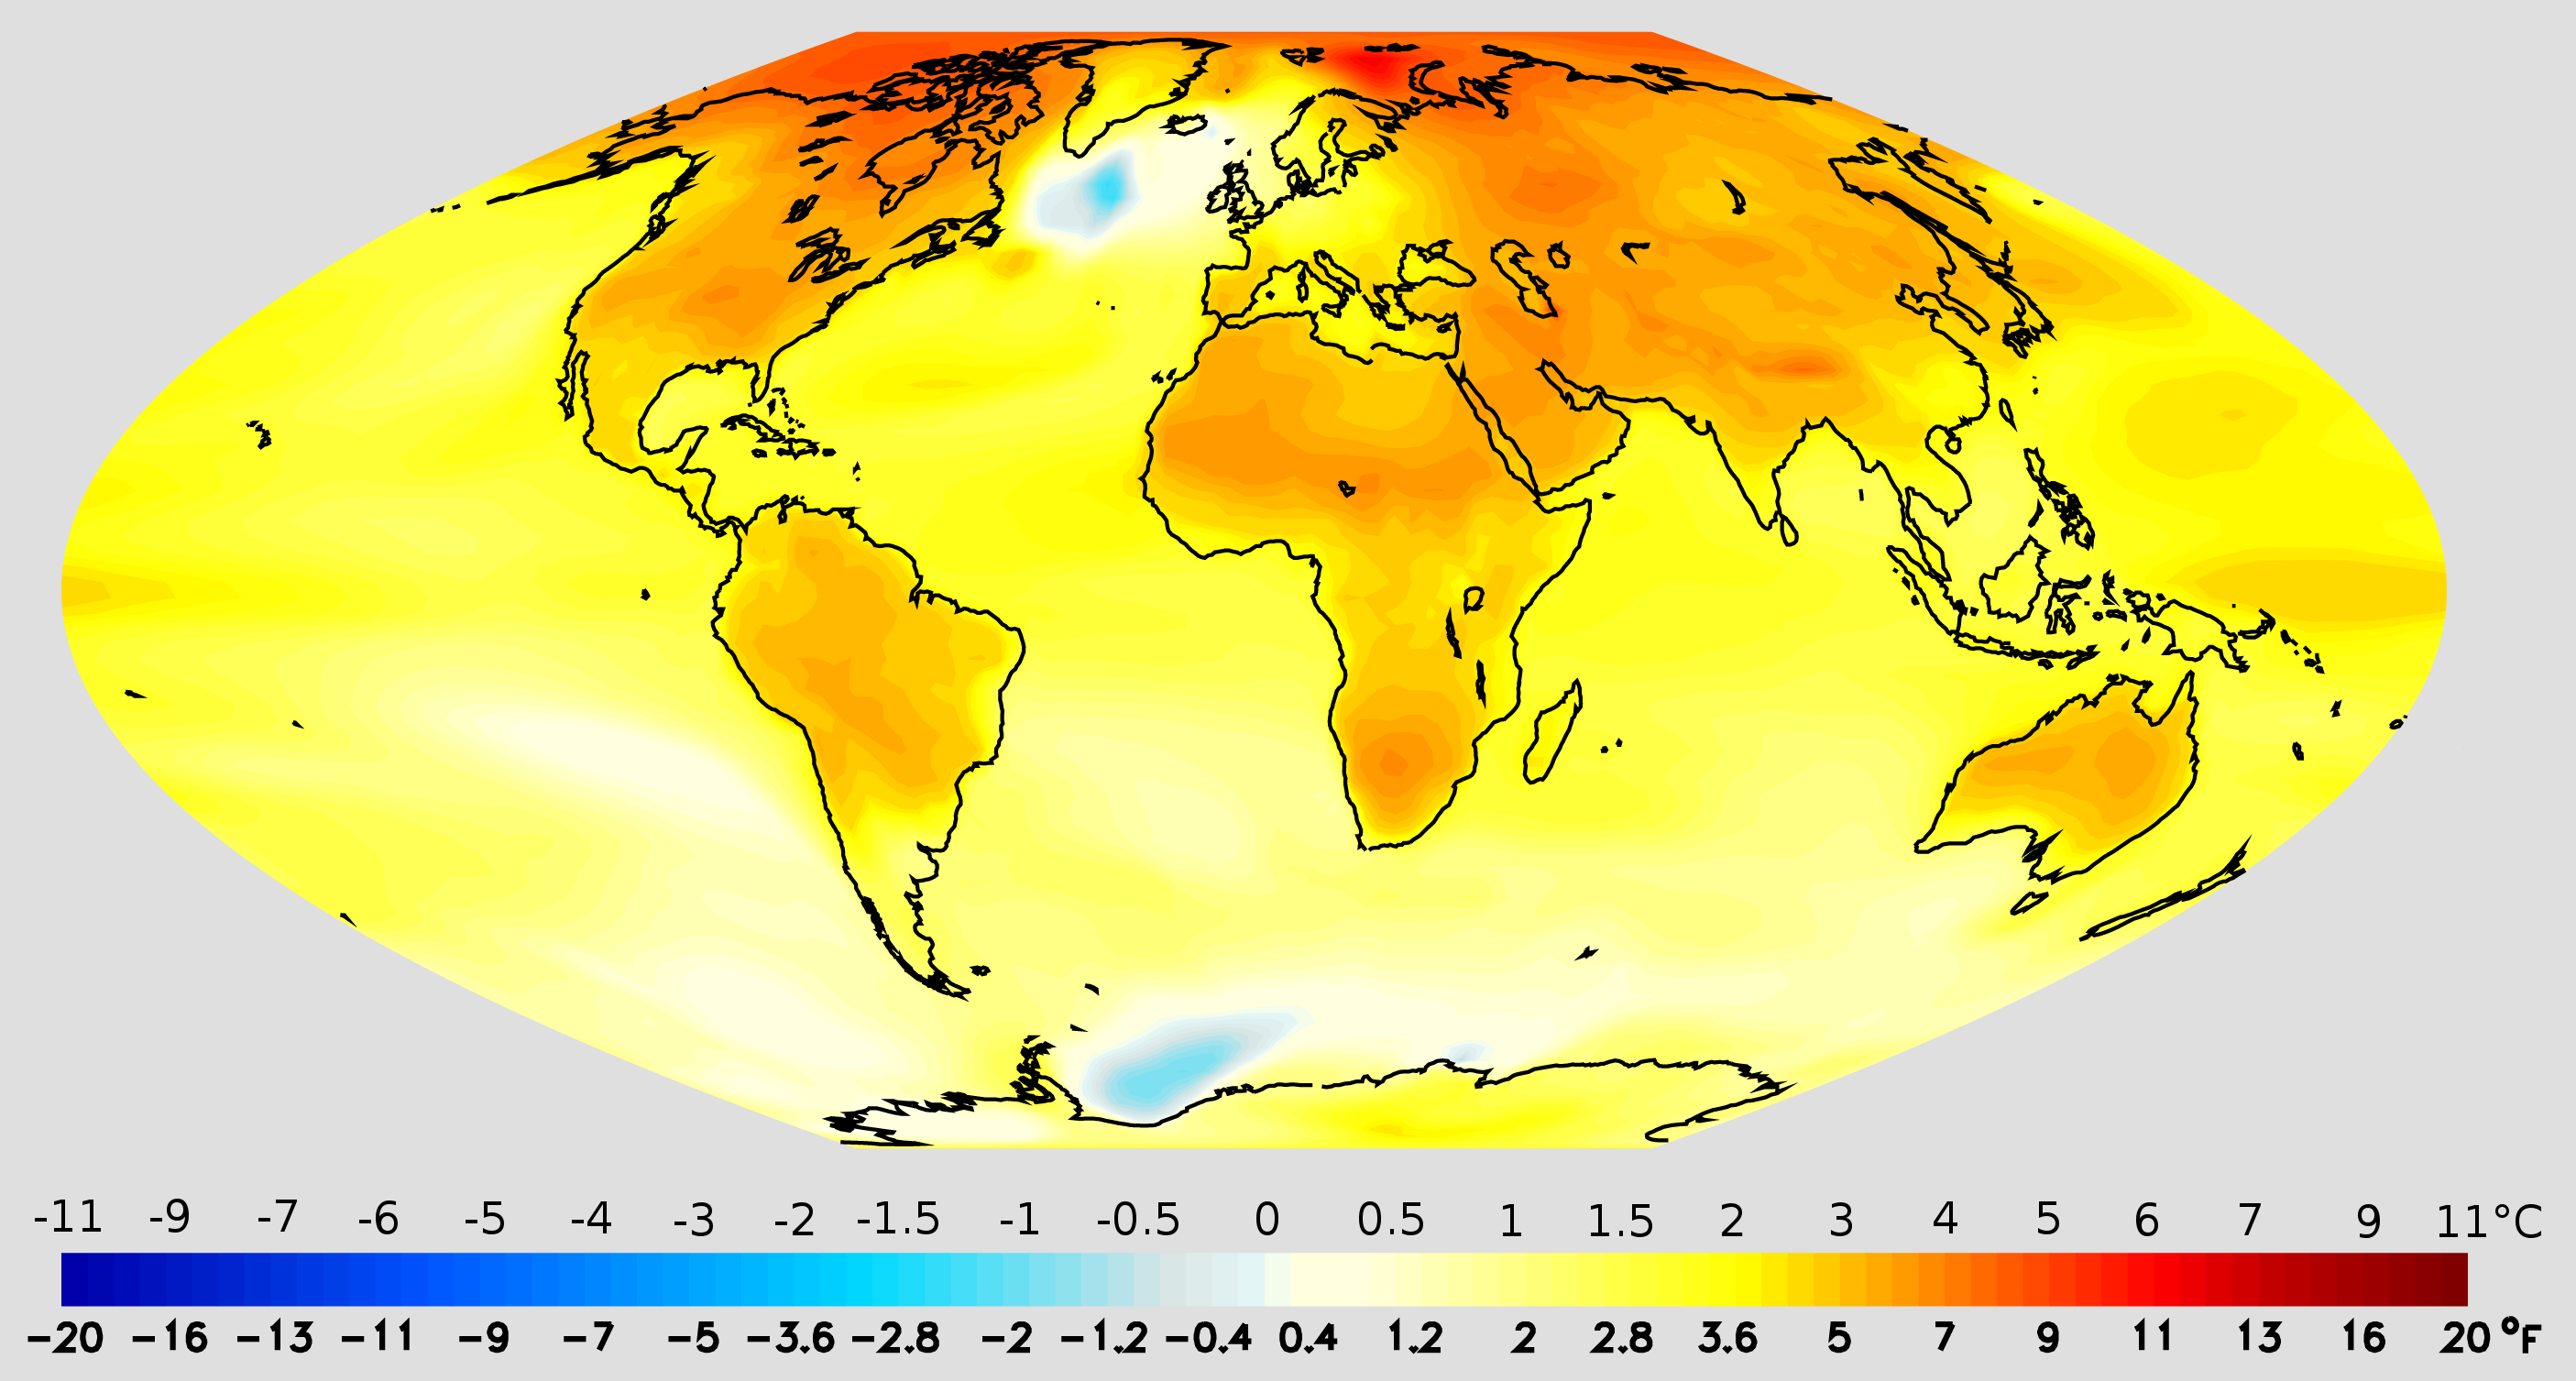
English: Surface air temperature change (2050s average minus 1971-2000 average), NOAA GFDL CM2.1 Climate Model, SRES A1B scenario. Description is based on the NOAA (2007a) public-domain source: This world map shows the projected change in annual mean surface air temperature from the late 20th century (1971-2000 average) to the middle 21st century (2051-2060 average). The change is in response to increasing atmospheric concentrations of greenhouse gases and aerosols based on a "middle of the road" estimate of future emissions. Future emissions are based on the "A1B" emissions scenario, taken from the Special Report on Emissions Scenarios. Warming is larger over continents than oceans, and is largest at high latitudes of the Northern Hemisphere. These results are from the GFDL CM2.1 model, but are consistent with a broad consensus of modeling results. From the NOAA (2007b) public-domain source: The term “global warming” is commonly used to refer to surface air temperature changes that are a response to increasing atmospheric greenhouse gas (GHG) concentrations. However, the warming is not expected to be uniform over the globe, nor is it expected to be the same during all seasons of the year. Computer model simulations conducted at NOAA’s Geophysical Fluid Dynamics Laboratory (GFDL) and elsewhere project that GHG induced warming will be more rapid over land masses than over oceans. In the image, red colors indicate greater warming over the continents. White and blue-green colors mark areas with the least warming or slight cooling, found mostly over oceans. Additionally, the greatest warming is expected during the winter over northern North America and north-central Asia. References:
|
| Datum | |
| Vir | Edited from Very High Resolution Version 3200 x 1901 png (693KB), in: NOAA GFDL Climate Research Highlights Image Gallery: Patterns of Greenhouse Warming, publisher: NOAA GFDL. Retrieved 2012-10-13. |
| Avtor | NOAA Geophysical Fluid Dynamics Laboratory (GFDL) |
| Dovoljenje (Nadaljnja uporaba datoteke) |
From cited the cited source: "The materials presented here help illustrate some of the key research results that GFDL scientists have reported on recently. These graphics are considered to be in the public domain, and thus can be downloaded freely. We do request that if these images are used in publications or media broadcasts credit be given to "NOAA Geophysical Fluid Dynamics Laboratory" or at least "NOAA GFDL"." |
| Druge različice | Animated version: File:Animation of projected annual mean surface air temperature from 1970-2100, based on SRES emissions scenario A1B (NOAA GFDL CM2.1 climate model).ogv |
Licenca
Ta slika je v javni domeni, saj vsebuje gradivo, ki ga je med opravljanjem uradnih dolžnosti posnel ali napravil uslužbenec Državne uprave Združenih držav Amerike za oceane in ozračje.
|
Zgodovina datoteke
Kliknite datum in čas za ogled datoteke, ki je bila takrat naložena.
| Datum in čas | Sličica | Velikost | Uporabnik | Komentar | |
|---|---|---|---|---|---|
| trenutno | 16:30, 1. december 2014 | | 2.811 × 1.507 (672 KB) | Olli Niemitalo | +Missing minus sign |
| 14:43, 1. december 2014 |  | 2.811 × 1.507 (672 KB) | Olli Niemitalo | Crop, added Celsius scale | |
| 05:25, 13. oktober 2012 |  | 3.200 × 1.901 (677 KB) | Enescot | {{Information |Description ={{en|1=Description is based on the cited public-domain source: This world map shows the projected change in annual mean surface air temperature from the late 20th century (197... |
Uporaba datoteke
Datoteka je del naslednje 1 strani slovenske Wikipedije (strani drugih projektov niso navedene):
Globalna uporaba datoteke
To datoteko uporabljajo tudi naslednji vikiji:
- Uporaba na ast.wikipedia.org
- Uporaba na cs.wikipedia.org
- Uporaba na da.wikipedia.org
- Uporaba na en.wikipedia.org
- Uporaba na es.wikipedia.org
- Uporaba na no.wikipedia.org
- Uporaba na pt.wikipedia.org
- Uporaba na uk.wikipedia.org